
For a long time now many have referred to Corsi and Fenwick numbers in conjunction with zone starts to determine the relative value of a player. In a recent article on HockeyAnalysis.com David Johnson has illustrated that zone starts are very much a function of a player’s role. That role also greatly affects Corsi and Fenwick percentages.
Essentially the zone starts of a player will only tell you what role they have played on a given team as opposed to past use of this metric indicating a more difficult level of competition. With traditional player evaluation metrics being heavily influenced by the role that player has, what can we use to give a better idea of how valuable a player is overall?
Thanks to War on Ice I was able to get data back to the 2007-08 NHL season for score adjusted statistics. I ran them all in a correlation matrix and found that Goals For per 60 minutes are most heavily correlated to shots on net On Ice Shooting Percentage and Unblocked shots On Ice Shooting Percentage.
The correlation is above 90% in this case indicating that the majority of the time the higher the shooting percentage, the higher the goals for per 60 minutes. Naturally on ice save percentage had the highest negative correlation to goals against per 60 minutes at over -85%.
I have come up with a grouping on four statistics that will help to give a good indication of the value of a player.
- ZSO%rel, Offensive zone starts relative to teammates.
- FF60+/- , Fenwick for per 60 minutes plus/minus.
- POFenSh%, personal and on ice Fenwick shooting percentage combined.
- Osv%rel, on ice save percentage relative to league average.
Both one and two need to be viewed in conjunction with each other. ZSO%rel gives an indication of a player’s role on their team, whether it is defensive based, offensive based or a mixture of the two. The FF60+/- statistic indicates how well the player fares at their role. A defensive player with a plus in this category is a very valuable commodity. On the opposite end an offensive player with a minus is not desirable.
Numbers three and four indicate a player’s effect on goals for and against while they are on the ice. The personal Fenwick shooting percentage and team shooting percentage while the player is on the ice gives an indication of how much a player contributes to goal scoring. As well the team shooting percentage might show that player helps in whatever fashion to generate higher quality scoring chances. While the on ice save percentage statistic can show whether a player is helping to limit quality scoring chances.
For example a player like Zdeno Chara would be measured as shown in the chart below. It shows he is largely used in a defensive role and in that role he has an above average Fenwick (unblocked shots) differential. However Chara has been below average this season in terms of on ice shooting and save percentages this season.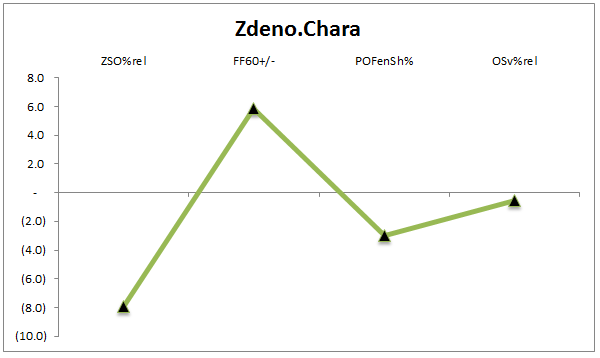
The chart gives a quick look into the player’s role and their relative value compared to the average NHLer in terms of contributing to goals for and against while on the ice.
Everyone wants one single number like WAR (wins above replacement) in Major League Baseball to evaluate NHL players. However this may be a long time coming. In the meantime your best bet is to look at a number of statistics in conjunction to get a good view into what type of player you are looking at and what is their relative value.