


Yesterday Run the Floor finalized our consensus top-100 rankings which consists of weighted ranks from multiple recruiting services. It had Nerlens Noel in the No. 1 position, as did the vast majority of service rankings.
Today we begin to break those data down.
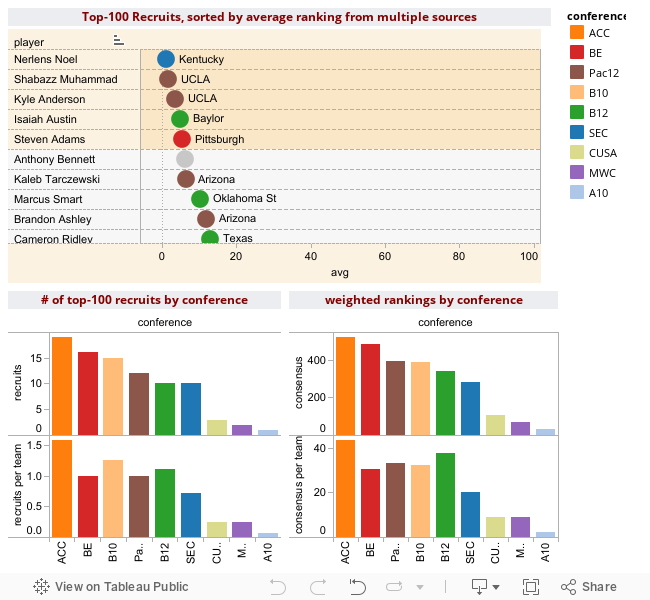
The infographic below (clickable, interactive) begins with the top-100 recruits, identified by conference, and sorted by their average ranking from multiple services. Clicking on the ‘SEC’ for example, shows not only the dominance of Kentucky’s recruiting class, but also the lack of elite recruits from the rest of the conference. Those numbers are presented in the bottom left, both in raw form, and corrected for the number of teams. The Big East has more top-100 recruits than the Big Ten, but they should, because they have 16 teams. By team, the Big Ten has more.
The bottom right is a similar chart, only that one is adjusted by the “value” of the recruit. Shabazz Muhammad should be more valued than Prince Ibeh or Kenny Kaminski, right? It may not work out that way in reality, but this is recruiting, and these are recruiting rankings.
The graphic is after the jump.