


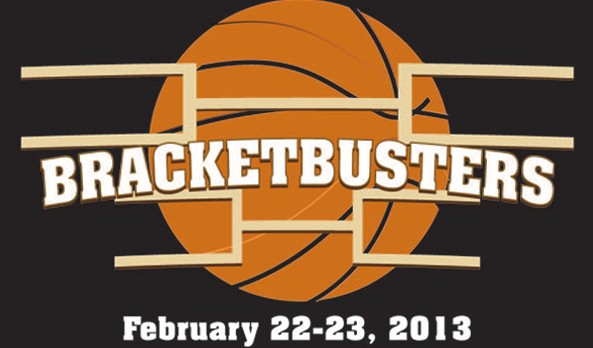
At long last we know what the final, terrible edition of ESPN BracketBusters BracketEliminators will look like. As Jeff Eisenberg expanded on here, St. Mary's won out by drawing Creighton at home — a major potential resume booster.
BracketBusters winner: Saint Mary's for drawing Creighton. BracketBusters loser: Every other potential at-large hopeful.
— Jeff Eisenberg (@JeffEisenberg) February 4, 2013
Everybody else has matchups in which a loss will likely hurt their resume more than a win will help. Business as usual.
Even so, there are no tenable arguments that BracketBusters doesn't make for fascinating basketball thanks to matchups which would not normally be possible — a world that high-major programs (read: Bill Self and Wichita State) would never submit to.
John Templon did a bang-up job of ranking the televised matchups, and you can see the schedule for those games right here, but I wanted to know which of the 61 total games offer the hope for scintillating basketball. Afterall, the vast majority of the 122 BracketBusters team have no shot at an at-large tournament bid anyway.
With the help of Ken Pomeroy's rankings, Excel, Google Maps and some Ramen I found some answers.
First, I looked at ranking disparity. I paired all 122 teams with their respective Pomeroy rankings (as of yesterday) and found the difference when compared with the team that they've been matched up with for BracketBusters. This provided disappointing results: Milwaukee is ranked 317th, and IUPUI is ranked 315th, but nobody wants to watch that game. Whatever, here are the seven games which feature teams that are ranked within 10 of each other on Pomeroy. TV games are in red.
| Road Team | Rank | Home Team | Rank | Disparity | |
| 1 | Northwestern St. | 130 | Niagara | 129 | 1 |
| 2 | Milwaukee | 317 | IUPUI | 315 | 2 |
| 3 | Pacific | 118 | W. Michigan | 111 | 7 |
| 4 | North Dakota St. | 35 | Akron | 42 | 7 |
| 5 | Eastern Illinois | 304 | Northern Illinois | 311 | 7 |
| 6 | Creighton | 15 | St. Mary's | 23 | 8 |
| 7 | The Citadel | 330 | Presbyterian | 338 | 8 |
So I went in a slightly different direction. I found that if you look only at matchups with a disparity value of less than 50 and then sort those games by the Pomeroy ranking of the home teams, you end up with 12 of the 13 televised games, followed by Evansville at Wright State, Green Bay at Drake and Jacksonville State at UNC Asheville.
These are probably the top 25 percent of BracketBusters matchups, and a solid indicator that Stephen F. Austin (No. 59) at Long Beach State (155) might not be a great television matchup despite the fact that the 49ers have won eight straight.
| Road Team | Rank | Home Team | Rank | Disparity | |
| 1 | Creighton | 15 | St. Mary's | 23 | 8 |
| 2 | Detroit | 62 | Wichita State | 28 | 34 |
| 3 | Ohio | 71 | Belmont | 32 | 39 |
| 4 | North Dakota St. | 35 | Akron | 42 | 7 |
| 5 | Denver | 50 | Northern Iowa | 64 | 14 |
| 6 | Iona | 97 | Indiana State | 67 | 30 |
| 7 | E. Kentucky | 131 | Valparaiso | 83 | 48 |
| 8 | Montana | 142 | Davidson | 95 | 47 |
| 9 | Pacific | 118 | W. Michigan | 111 | 7 |
| 10 | Canisius | 107 | Vermont | 121 | 14 |
| 11 | Northwestern St. | 130 | Niagara | 129 | 1 |
| 12 | South Dakota St. | 101 | Murray State | 133 | 32 |
| 13 | Evansville | 110 | Wright State | 137 | 27 |
| 14 | Green Bay | 113 | Drake | 143 | 30 |
| 15 | Jacksonville St. | 203 | UNC Asheville | 159 | 44 |
Still, that didn't seem satisfying. Great basketball needs some feeling of rivalry. Atmosphere is part of the experience. So I used Google Maps to find the distances between every pair of schools for all 61 games, working under the (actually kind of silly) supposition that geographical proximity enhances atmosphere.
Anyway, it made for an interesting data set, so here are all 61 games, ranked by shortest driving distance given by Google Maps. I estimated for Hawaii. Television games are in red. There are more words after the data.
| Road Team | Rank | Home Team | Rank | Disparity | Distance (miles) | |
| 1 | Bowling Green | 205 | IPFW | 286 | 81 | 91 |
| 2 | Albany | 186 | Fairfield | 108 | 78 | 145 |
| 3 | Bradley | 170 | Illinois-Chicago | 184 | 14 | 168 |
| 4 | The Citadel | 330 | Presbyterian | 338 | 8 | 171 |
| 5 | Loyola Marymount | 241 | Cal Poly | 165 | 76 | 191 |
| 6 | Eastern Illinois | 304 | Northern Illinois | 311 | 7 | 221 |
| 7 | Gardner-Webb | 192 | Coll. of Charleston | 135 | 57 | 239 |
| 8 | Texas State | 258 | Lamar | 341 | 83 | 253 |
| 9 | Evansville | 110 | Wright State | 137 | 27 | 275 |
| 10 | Milwaukee | 317 | IUPUI | 315 | 2 | 276 |
| 11 | Savannah St. | 206 | Campbell | 276 | 70 | 300 |
| 12 | Jacksonville St. | 203 | UNC Asheville | 159 | 44 | 304 |
| 13 | Coastal Carolina | 200 | Western Carolina | 237 | 37 | 338 |
| 14 | Central Michigan | 245 | Youngstown St. | 148 | 97 | 354 |
| 15 | Ball State | 252 | SE Missouri St. | 266 | 14 | 362 |
| 16 | E. Kentucky | 131 | Valparaiso | 83 | 48 | 364 |
| 17 | Morgan State | 248 | High Point | 213 | 35 | 370 |
| 18 | SIU Edwardsville | 281 | Central Arkansas | 265 | 16 | 371 |
| 19 | Miami (Ohio) | 255 | Southern Illinois | 221 | 34 | 371 |
| 20 | Canisius | 107 | Vermont | 121 | 14 | 374 |
| 21 | Kent State | 138 | Loyola-Chicago | 164 | 26 | 376 |
| 22 | Morehead St. | 195 | Oakland | 182 | 13 | 393 |
| 23 | Sacramento St. | 262 | UC Santa Barbara | 211 | 51 | 396 |
| 24 | Manhattan | 223 | Buffalo | 188 | 35 | 400 |
| 25 | St. Peter's | 294 | Hampton | 271 | 23 | 402 |
| 26 | Ohio | 71 | Belmont | 32 | 39 | 425 |
| 27 | Green Bay | 113 | Drake | 143 | 30 | 443 |
| 28 | CS Northridge | 187 | Southern Utah | 269 | 82 | 461 |
| 29 | VMI | 270 | Marist | 287 | 17 | 468 |
| 30 | North Dakota | 272 | Nebraska-Omaha | 321 | 49 | 497 |
| 31 | Nicholls State | 284 | UT San Antonio | 253 | 31 | 526 |
| 32 | Idaho | 179 | Idaho State | 334 | 155 | 534 |
| 33 | Austin Peay | 319 | Liberty | 292 | 27 | 537 |
| 34 | Cleveland St. | 243 | W. Illinois | 134 | 109 | 588 |
| 35 | Radford | 263 | Siena | 296 | 33 | 621 |
| 36 | UMKC | 329 | Tennessee Tech | 302 | 27 | 633 |
| 37 | Charleston So. | 163 | Rider | 191 | 28 | 688 |
| 38 | Longwood | 342 | Tennessee Martin | 327 | 15 | 689 |
| 39 | Loyola-Maryland | 127 | Tennessee State | 185 | 58 | 709 |
| 40 | SE Louisiana | 300 | Winthrop | 230 | 70 | 718 |
| 41 | Missouri State | 208 | E. Michigan | 246 | 38 | 733 |
| 42 | Denver | 50 | Northern Iowa | 64 | 14 | 797 |
| 43 | Iona | 97 | Indiana State | 67 | 30 | 808 |
| 44 | South Dakota St. | 101 | Murray State | 133 | 32 | 881 |
| 45 | South Dakota | 235 | Montana State | 260 | 25 | 916 |
| 46 | Detroit | 62 | Wichita State | 28 | 34 | 957 |
| 47 | North Dakota St. | 35 | Akron | 42 | 7 | 1008 |
| 48 | UC Riverside | 312 | Portland State | 299 | 13 | 1016 |
| 49 | Northern Colorado | 274 | UC Davis | 217 | 57 | 1151 |
| 50 | McNeese State | 314 | Toledo | 173 | 141 | 1193 |
| 51 | Weber State | 93 | Oral Roberts | 160 | 67 | 1213 |
| 52 | Northwestern St. | 130 | Niagara | 129 | 1 | 1353 |
| 53 | Illinois State | 65 | Utah State | 125 | 60 | 1359 |
| 54 | UC Irvine | 153 | Texas-Arlington | 168 | 15 | 1408 |
| 55 | Cal State Fullerton | 177 | Texas A&M CC | 322 | 145 | 1493 |
| 56 | Stephen F. Austin | 59 | Long Beach St. | 155 | 96 | 1618 |
| 57 | Creighton | 15 | St. Mary's | 23 | 8 | 1658 |
| 58 | Sam Houston St. | 234 | E. Washington | 308 | 74 | 2150 |
| 59 | Pacific | 118 | W. Michigan | 111 | 7 | 2277 |
| 60 | Montana | 142 | Davidson | 95 | 47 | 2324 |
| 61 | Northern Arizona | 301 | Hawaii | 202 | 99 | 2900 |
| Average | 199.8 | 200.8 | 45.4 | 741.8 |
You'll notice that the average away team will travel about 740 miles for BracketBusters in 2013, part of the reason everyone hates the thing.
The average BracketBusters game will feature teams that are separated in the Pomeroy rankings by an average figure of 45.
Bowling Green (91 miles) has the shortest trip of any team. The Falcons are 1-1 all-time vs. IPFW.
Valparaiso, which traveled to California from Indiana for a BracketBusters loss at Loyola Marymount last year (Bryce Drew was sure to mention that on ESPNU yesterday) received an opponent in Eastern Kentucky that is less than 400 miles away — the easiest commute of any of the televised games.
Teams with ridiculous trips that won't even be on TV include Northern Arizona (~2,900 miles), Sam Houston St. (2,150) and Cal State Fullerton (1,493).
Why the Titans have to travel 1,493 miles to play an absolutely dreadful Texas A&M Corpus Christi team that has one total win over a D-I opponent this season (uhh, Lamar) is unfathomable.
Thankfully, the end of BracketBusters forever is near.