
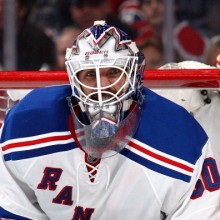


Kari Lehtonen #32 G
- 27 years old. Will be entering his eighth season of NHL play next year.
- 2 years left on his contract. Restricted free agent in the 2013-2014 season.
- Will make $3.55 million next season.
| Year | GP | GS | Min | Wins | Losses | OTL | GA | GAA | SA | SV | SV% | SO |
| 2010-2011 | 69 | 68 | 4119:11 | 34 | 24 | 11 | 175 | 2.55 | 2043 | 1868 | .914 | 3 |
| Career Averages | 40 | 39 | 2350:34 | 19 | 16 | 4 | 109.2 | 2.79 | 1250.7 | 1141.4 | .913 | 2.4 |
| Peak Numbers | 69 | 68 | 4119:11 | 34 | 24 | 11 | 183 | 1.25 | 2075 | 1892 | .953 | 4 |
Poor Kari Lehtonen found himself as the target of a shooting gallery the entire season. Playing in front of a defense that looked lost at times and was rotating players weekly, Lehtonen performed admirably for much of the season.
Since being traded over to the Stars for prospect Ivan Vishnevskiy, Lehtonen has a been shown flashes as to why he was the second overall pick in the 2002 draft. For all intensive purposes, this was his best statisical year in his career. Many of his career highs before this season came in his first year in the league, when he played only four games.
If that abbreviated season is taken out of the picture, Lehtonen set a personal best with his 2.55 goals against average this year and his .914 save percentage was the second best in his career. If he can get something that even resembles a solid defense in front of him (and stay healthy), he has the tools to be one of the top-15 or top-10 goalies in the league.
Instead, Lehtonen found himself pelted by the vulcanized rubber each and every night he was out there. Here is how he ranked in the NHL against the other goalies in the league.
- Fourth in the league in shots faced, saves and games played. He was behind Cam Ward, Carey Price and Ilia Bryzgalov in each of these categories.
- Third worst in the NHL in terms of goals allowed this season with his 175. Only Miika Kiprusoff and Cam Ward allowed more.
- Goals against average – 17th in the league.
- Tied for 23rd in save percentage.
It’s actually pretty astonishing that he managed to play as many games as he did, considering that he has had a history of injury problems. His 69 games played this year is 11 games more than he has played the previous two years. The lack of consistent ice-time in his career started to show a bit towards the end of the season because he started to look tired and lost his concentration at times.
As he started to tire at the end of the season, his technique suffered and he started to drift a lot. He began to get out of postion on shots and rebounds (he gave up a lot of rebounds late in the year) and he found himself further and further away from the net when facing shots. Some of this could be attributed to the fact that the defense was horrendous in front of him so he had to be more aggressive, but it’s something that needs to be fixed.
Lehtonen also struggled against the division foes, winning 8 of 22 games and allowing 64 goals in those games. The only Pacific team he did well against was the Phoenix Coyotes, against which he had a 1.98 GAA and .930 save percentage. The further west he went, the worse he became, with the worst being a 6.00 GAA and .795 save percentage against the Vancouver Canucks.
Going into next year, it will be important for Lehtonen to stay healthy, whether its from a rigorous offseason training program or more days off during the year next season. Dallas needs to find defensemen that can help Lehtonen out or another season filled with four or five goal games will pepper the season. The Stars have him signed on for two more seasons and after that it will be unknown what his future with the team will be. He’s still a relatively young player but Dallas has 19-year-old Jack Campbell waiting in the wings to take over as the goalie of the team.
No matter the case, the Stars need Lehtonen to either match or, preferably, improve on this season’s stats if they hope to make the playoffs next year.
Stats Legend:
- GP: Games Played
- GS: Games Started
- MIN: Minutes
- OTL: Overtime Losses
- GA: Goals Against/Allowed
- GAA: Goals Against Average
- SA: Shots Against
- SV: Saves
- SV%: Save Percentage
- SO: Shutouts