There’s more to be said in response to the question, “How much does a four-yards-per-carry average matter in a game?” Our overview of this issue got things started, but how do the nation’s FBS teams stack up within the context of their conferences?
That’s what we’ll look at in this final installment of our Statistical Summer series at TSS.
Below are the league rankings for teams from each of the power five conferences. Where appropriate, we’ll add a few extra notes about each team’s profile since the 2005 college football season.
*
FOUR YARDS PER CARRY SINCE THE 2005 SEASON
PART I: WINS
ACC
NOTE: Louisville, Syracuse and Pittsburgh are not included, since they spent most or all of the past nine seasons in other conferences. Maryland, though now in the Big Ten, is included.
1) Georgia Tech, 60 (92 games played, third-most of all teams surveyed since 2005)
2) Clemson, 55
3) Florida State, 54
4) Virginia Tech, 50
5) Miami (FL), 40
6) Boston College, 35
7) North Carolina, 32
8) Maryland, 29
9) Virginia, 21
10) Wake Forest, 20
11) North Carolina State, 18
12) Duke, 14
*
BIG 12
NOTE: TCU and West Virginia are not included, since they were not Big 12 schools for most of the past nine seasons. Missouri and Texas A&M are included, however, despite their current affiliations with the SEC. Nebraska is included here, since it spent six of the past nine seasons in the league, not in its current Big Ten home. The same principle applies to Colorado, though now in the Pac-12.
1) Oklahoma, 61
2) Tie — Missouri and Texas, 58
4) Oklahoma State, 57
5) Texas A&M, 55
6) Nebraska, 50
7) Kansas State, 48
8) Texas Tech, 41
9) Baylor, 40
10) Kansas, 31
11) Iowa State, 21
12) Colorado, 20
*
BIG TEN
NOTE: Nebraska, Maryland and Rutgers are not included for reasons made plain above.
1) Ohio State, 80
2) Wisconsin, 65
3) Penn State, 60
4) Michigan, 49
5) Michigan State, 46
6) Iowa, 36
7) Purdue, 35
8) Minnesota, 33
9) Northwestern, 32
10) Illinois, 31
11) Indiana, 20
*
PAC-12
NOTE: Utah and Colorado are not included.
1) Oregon, 84
2) USC, 66
3) Stanford, 52
4) California, 48
5) Arizona, 38
6) Arizona State, 37
7) Oregon State, 35
8) UCLA, 34
9) Washington, 33
10) Washington State, 15
*
SEC
NOTE: Missouri and Texas A&M not included.
1) LSU, 70
2) Alabama, 67
3) Florida, 63
4) Auburn, 56
5) Georgia, 52
6) Arkansas, 43
7) South Carolina, 42
8) Mississippi State, 39
9) Ole Miss, 35
10) Tennessee, 30
11) Vanderbilt, 29
12) Kentucky, 27
*
PART II: GAMES PLAYED
ACC
1) Georgia Tech, 92
2) Clemson, 67
3) Florida State, 65
4) Miami (FL), 61
5) Virginia Tech, 56
(Overall record in these 56 games: 50-6. The Hokies had the third-smallest loss total for any power-conference team that played at least 50 games with four yards per carry since 2005. Virginia Tech finished tied with Oklahoma at six losses. The Sooners, though, went 61-6.)
6) Tie — Boston College and Maryland, 44
8) North Carolina, 43
9) Virginia, 39
10) Tie — North Carolina State and Wake Forest, 32
12) Duke, 31
*
BIG 12

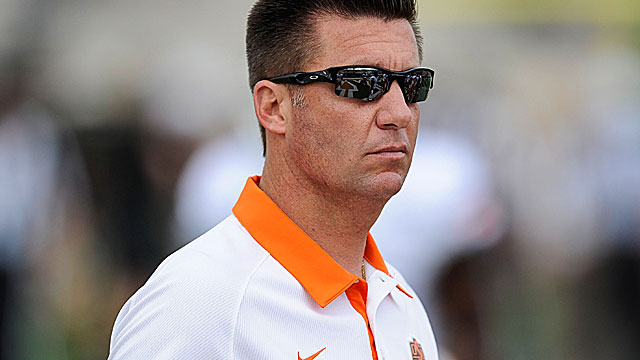
How has Mike Gundy turned around the Oklahoma State program? Many valid answers exist, and naturally, a combination of improvements — not just one in isolation — truly tells the tale. That said, one window into OSU’s success is the program’s ability to average at least four yards per carry on gameday. The Cowboys have played 79 such games since 2005, best in the Big 12. That should get the attention of Texas, Oklahoma, and reigning Big 12 champion Baylor.
1) Oklahoma State, 79
2) Texas A&M, 76
3) Missouri, 71
4) Texas, 68
5) Oklahoma, 67
6) Tie — Kansas State and Nebraska, 65
8) Baylor, 55
9) Texas Tech, 53
10) Kansas, 51
11) Iowa State, 44
12) Colorado, 41
*
BIG TEN
1) Ohio State, 89
2) Wisconsin, 80
3) Penn State, 72
4) Michigan, 64
5) Michigan State, 62
6) Tie — Illinois and Purdue, 60
(Yes, Purdue and Illinois used to be decent teams — that’s what this number tells you.)
8) Northwestern, 52
9) Minnesota, 51
10) Iowa, 49
11) Indiana, 47
*
PAC-12
1) Oregon, 95
2) USC, 80
3) California, 74 (How soon we forget: Cal used to be a contender.)
4) Stanford, 68
5) Washington, 59
6) Arizona State, 52
7) Arizona, 51
8) UCLA, 49
9) Oregon State, 45
10) Washington State, 28
*
SEC
1) Tie — Florida and LSU, 74
LSU has lost only four games since 2005 when averaging at least four yards per carry.
3) Alabama, 72
Alabama has lost only five times since 2005 when averaging at least four yards per carry. Alabama and LSU are the only two teams that have lost fewer than six games while playing a minimum of 50. Virginia Tech and Oklahoma, as mentioned above, are the two teams with exactly six losses when playing a minimum of 50 games.
4) Arkansas, 69
5) Auburn, 67
6) Georgia, 66
7) Ole Miss, 58
8) Mississippi State, 53
9) South Carolina, 52
10) Tennessee, 47
11) Kentucky, 46
12) Vanderbilt, 45
*
PART III: WINNING PERCENTAGE
ACC

When Frank Beamer’s teams average at least four yards per carry, they very rarely lose. Hitting the four-yard barrier carries a profound degree of significance at Virginia Tech, compared to other power-conference programs across the country. The inability to establish the running game in recent years is precisely why the program has struggled.
1) Virginia Tech, .893
2) Florida State, .831
3) Clemson, .821
4) Boston College, .795
5) North Carolina, .744
6) Maryland, .659
7) Miami (FL), .656
8) Georgia Tech, .652
9) Wake Forest, .625
10) North Carolina State, .563
11) Virginia, .538
12) Duke, .452 — Imagine what this winning percentage was two years ago.
*
BIG 12
1) Oklahoma, .910
2) Texas, .853
3) Missouri, .817
4) Texas Tech, .774
5) Nebraska, .769
6) Kansas State, .738
7) Baylor, .727
8) Texas A&M, .724
9) Oklahoma State, .722
10) Kansas, .608
11) Colorado, .488
12) Iowa State, .477
*
BIG TEN
1) Ohio State, .899
2) Penn State, .833
3) Wisconsin, .813
4) Michigan, .766
5) Michigan State, .742
6) Iowa, .735
7) Minnesota, .647
8) Northwestern, .615
9) Purdue, .583
10) Illinois, .517
11) Indiana, .426
*
PAC-12
1) Oregon, .884
This is the best winning percentage for power-conference teams for the number of games played (95) since 2005. LSU is the overall winning percentage leader, but the Tigers played only 74 games. Ohio State does have a slightly higher winning percentage than Oregon (.899, listed above), but the Buckeyes achieved that mark in “only” 89 games, six below Oregon’s total.
2) USC, .825
3) Oregon State, .778
4) Stanford, .765
5) Arizona, .745
6) Arizona State, .712
7) UCLA, .694
8) California, .649
9) Washington, .559
10) Washington State, .536
*
SEC
1) LSU, .946 (tops in the country among all power-conference teams surveyed)
2) Alabama, .931 (second overall, not just in the SEC)
3) Florida, .851 (No. 11 overall)
4) Auburn, .836 (No. 13 overall)
5) South Carolina, .808
6) Georgia, .788
The SEC placed six teams in the top 25 overall, with Georgia rounding out the list.
7) Mississippi State, .736
8) Vanderbilt, .644
9) Tennessee, .638 — Tennessee finishing this far down the list is telling.
10) Arkansas, .623
11) Ole Miss, .603
12) Kentucky, .587

