


I’m not sure why, in any sport, there has to be a divide and a war between those who produce statistical analysis, and those who just want to watch the game. We can have both.
That battle was at its peak in 2011, during the height of Tim Tebow’s NFL reign. I hesitate to even bring his name up here, because its mere mention clouds judgement. But Tebow remains the prime example of a player propped up by those who shunned analysis and any thinking that went beyond a surface, yet honed in on a select few surface stats. Numbers that say little, and but still offer black and white support of a viewpoint. All numbers do that, right?
Well, no. Not really.
Dalton and Peyton Manning’s numbers in the first 3 years of their careers are remarkably similar #SNF pic.twitter.com/1bqeM8B314
— SNF on NBC (@SNFonNBC) August 25, 2014
Of the seven stats there shown by NBC last night, two simply highlight the amount of work each quarterback had over the time period in question. Neither Andy Dalton or Peyton Manning missed a game during their first three seasons, and the amount their respective offenses asked them to throw was similar.
Two more numbers focus on touchdown:interception ratios, with Manning only narrowly ahead in touchdowns, and he threw nine more picks in his first three years. What’s misleading is any comparison whatsoever between the NFL in 1998 and 1999, and the league of today. I get that NBC’s purpose is to compare young Manning to young Dalton, but the former played his early seasons in a much different time, long before the passing revolution had taken a firm grip.
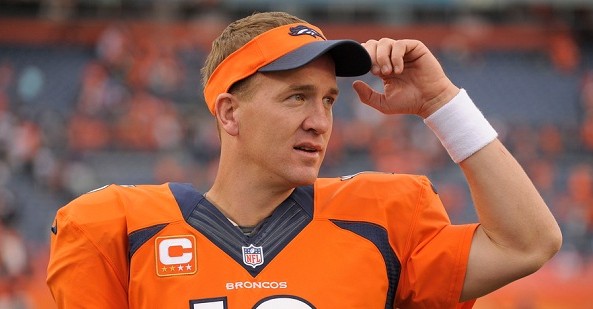
Here’s a better perspective using modern numbers. Over his three most recent full seasons (nearly the same time period NBC used for Dalton’s numbers, as Manning missed all of 2011) Manning has attempted 1,921 passes. That’s significantly more than his first three seasons in the league (242 more, to be exact), and far more than Dalton even in these modern pass happy times.
Yet despite that volume, Manning has thrown just 38 interceptions during his first two seasons in Denver, and last in Indianapolis. That includes only 10 picks in 2013, even while attempting a league leading 659 throws.
Then there’s Manning’s touchdowns in this modern area of aerial offense. Last year he established a new single-season record with 55 touchdown passes, and over his past three seasons he’s thrown 125 TDs. That’s 45 more than Dalton.
There are great stats and bad stats, and a perfect stat doesn’t exist. But trying to modernize numbers that are over a decade old is an odd effort.
Two other numbers used by NBC are quarterback wins (both post-season and regular season). Thanks in part to the First Take sports TV revolution and the rise of the hot take, quarterback wins has increasingly been used as a metric to gauge talent. Which is pretty baffling, but the explanation for the popularity of quarterback wins is easy: we crave a quick, simplified answer to a complicated question.
A quarterback can certainly make key plays, and crucial throws, and he can do it while leading his team down the field for a game-winning drive. But what necessitated that heroic effort? A score allowed by the defense. The same defense the quarterback sits (or stands) and watches all game from the sideline.
Winning and losing never falls solely on the shoulders or arms of one man, which is what we’re communicating by tracking it as a statistic, and caring about it intensely. A win or a loss is a team effort. Always.