


The NHL recently announced they will soon provide advanced statistics such as Corsi and Fenwick as part of their NHL.com offerings. However, in this age of maturing hockey analytics, the metrics quantifying the impact of player injuries on a team are very frequently ignored.
CHIP (Cap Hit of Injured Player) and our TMITT metric (Time Missed Impact To Team) are arguably not on anyone’s radar. Yet. We compare them head to head here.
There are a myriad number of ways to measure a player’s value to their team. Which is best? The answer is that it depends on the player, their role, and their performance (past and future). How well do they score? Eat minutes? Hit? Stop pucks? Thankfully, we can measure the past.
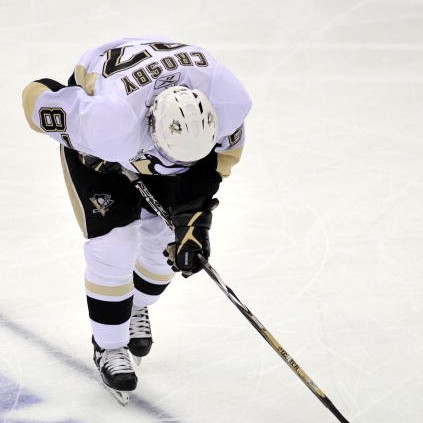
DETROIT – JUNE 12: Sidney Crosby #87 of the Pittsburgh Penguins skates of off the ice after getting injured against the Detroit Red Wings during Game Seven of the 2009 NHL Stanley Cup Finals at Joe Louis Arena on June 12, 2009 in Detroit, Michigan. (Photo by Jamie Sabau/Getty Images)
The CHIP metric bases an injured player’s value to their team on their salary’s cap hit on the team’s books, and the duration of their injury. The belief is that the higher a player’s cap hit, the higher their value to the team. Each game a player is injured is quantified based on the cumulative amount of money that is ‘wasted’ as ‘lost’ cap hit for the team.
Is CHIP a flawed metric? Perhaps. It doesn’t account for the player’s role on the team. Also, General Managers and player agents decide a player’s cap hit based on the player’s past performance. Bad contracts exist.
In contrast, our TMITT metric bases a player’s value to their team on their average time on ice (ATOI) and the duration of their injury. The more a player is consistently used by their coach on the ice during each game, the higher their value to the team. However, just like bad contracts, bad coaches exist.
Regardless, coaches tend to give better players more ice time. A higher TMITT number means a larger impact of a player’s injury to the team. Make sense?
Our standard TMITT metric is TMITT-skater for forwards and defensemen, and TMITT-goalie for goalies. Several variants of TMITT also take into account other basic performance metrics for hockey players – TMITT-goals for goals scored, TMITT-points for total points, TMITT-hits for number of hits, TMITT-gaa for goals against average (for goalies), etc. You get the hint.
A frequent criticism of TMITT is that it overvalues defensemen on a team (and their injuries) since defensemen typically play more minutes in a game, i.e. have higher ATOI figures. I would counter that this is exactly how it should be. Defensemen (good ones) ARE more valuable to a team.
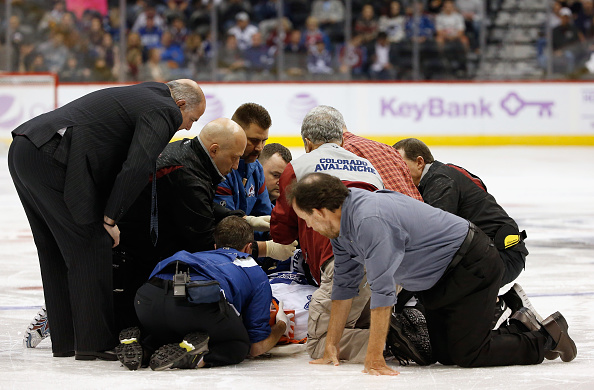
DENVER, CO – NOVEMBER 06: Daniel Winnik #26 of the Toronto Maple Leafs is attended to as he lies unconcious on the ice after being injured in the opening minute of action against the Colorado Avalanche at Pepsi Center on November 6, 2014 in Denver, Colorado. The Avalanche defeated the Maple Leafs 4-3 in an overtime shootout. (Photo by Doug Pensinger/Getty Images)
I would argue that losing your top defenseman to injury for 20 games is worse than losing your top forward to injury for 20 games. There are only 6 defensemen on a game roster. There are 12 forwards.
Thus, the TMITT metric takes into account a player’s role on the team, and their performance via their ATOI – two primary measurements of a player’s value to a team. Add in the TMITT variants, including goals, assists, hits, GAA, etc. and it does more than just quantifying an injury based on cap hit for the player.
We thought we’d take this opportunity to pit CHIP against TMITT to quantify the impact of player injuries to a team. Below are three tables of data. They contain the top thirty ratings of players who have been injured, measured by CHIP or TMITT.
Table 1 contains the top 30 CHIP values quantifying the impact of players (forwards and defensemen) injured for some duration this year. Also shown are the position they play and the number of official games their team reported them injured.
Table 2 (TMITT-skater) and Table 3 (TMITTb-skater, a new variant we’re testing) provide the top 30 TMITT values quantifying the impact of forwards and defensemen injured for some duration this season. These tables also show player positions and the number of official games their team reported them injured.
In your view, which table more accurately reflects the proper ranking of players injured at some point during this season, taking into consideration the position they play, and the duration of their injury?
Let us know through Twitter or via our Contact form.
TABLE 1. NHL TOP 30 CHIP CALCULATIONS JANUARY 29, 2015
| Rank | NameNumber | Team | Position | CHIP (in millions of $) | Injured (Team Reported) |
|---|---|---|---|---|---|
| Ryane Clowe #29 | New Jersey Devils | Left Wing | 2.011 | 34 | |
| Zdeno Chara #33 | Boston Bruins | Defenseman | 1.6027 | 19 | |
| Corey Perry #10 | Anaheim Ducks | Right Wing | 1.5777 | 15 | |
| Ryan Murray #27 | Columbus Blue Jackets | Defenseman | 1.4913 | 35 | |
| Joffrey Lupul #19 | Toronto Maple Leafs | Left Wing | 1.4726 | 23 | |
| Pascal Dupuis #9 | Pittsburgh Penguins | Right Wing | 1.4177 | 31 | |
| Toby Enstrom #39 | Winnipeg Jets | Defenseman | 1.3323 | 19 | |
| Bryce Salvador #24 | New Jersey Devils | Defenseman | 1.2359 | 32 | |
| Dan Hamhuis #2 | Vancouver Canucks | Defenseman | 1.2073 | 22 | |
| Artem Anisimov #42 | Columbus Blue Jackets | Center | 1.2011 | 30 | |
| Ryan Wilson #44 | Colorado Avalanche | Defenseman | 1.1524 | 42 | |
| Dave Bolland #63 | Florida Panthers | Center | 1.1402 | 17 | |
| David Krejci #46 | Boston Bruins | Center | 1.0884 | 17 | |
| Valeri Nichushkin #43 | Dallas Stars | Right Wing | 1.0625 | 41 | |
| Jamie McGinn #11 | Colorado Avalanche | Left Wing | 1.0433 | 29 | |
| Zach Bogosian #44 | Winnipeg Jets | Defenseman | 0.9408 | 15 | |
| Victor Hedman #77 | Tampa Bay Lightning | Defenseman | 0.878 | 18 | |
| Dan Boyle #22 | New York Rangers | Defenseman | 0.878 | 16 | |
| Evander Kane #9 | Winnipeg Jets | Left Wing | 0.8323 | 13 | |
| Benoit Pouliot #67 | Edmonton Oilers | Left Wing | 0.7805 | 16 | |
| Stephen Weiss #90 | Detroit Red Wings | Center | 0.7768 | 13 | |
| Marian Gaborik #12 | Los Angeles Kings | Right Wing | 0.7729 | 13 | |
| Eric Brewer #2 | Anaheim Ducks | Defenseman | 0.7695 | 22 | |
| Francois Beauchemin #23 | Anaheim Ducks | Defenseman | 0.7683 | 18 | |
| Mike Cammalleri #23 | New Jersey Devils | Left Wing | 0.7317 | 12 | |
| Johan Franzen #93 | Detroit Red Wings | Right Wing | 0.7235 | 15 | |
| Fedor Tyutin #51 | Columbus Blue Jackets | Defenseman | 0.7134 | 13 | |
| Brad Stuart #17 | Colorado Avalanche | Defenseman | 0.7024 | 16 | |
| Lubomir Visnovsky #11 | New York Islanders | Defenseman | 0.6951 | 12 | |
| Mason Raymond #21 | Calgary Flames | Left Wing | 0.6915 | 18 |
TABLE 2. NHL TOP 30 TMITT-SKATER CALCULATIONS JANUARY 29, 2015
| Rank | NameNumber | Team | Position | TMITT-skater | Injured (Team Reported) |
|---|---|---|---|---|---|
| Toby Enstrom #39 | Winnipeg Jets | Defenseman | 283.6 | 19 | |
| Zdeno Chara #33 | Boston Bruins | Defenseman | 262 | 19 | |
| Francois Beauchemin #23 | Anaheim Ducks | Defenseman | 255 | 18 | |
| Dan Hamhuis #2 | Vancouver Canucks | Defenseman | 237.4 | 22 | |
| Jacob Trouba #8 | Winnipeg Jets | Defenseman | 236.1 | 15 | |
| Victor Hedman #77 | Tampa Bay Lightning | Defenseman | 233.6 | 18 | |
| Zach Bogosian #44 | Winnipeg Jets | Defenseman | 233.1 | 15 | |
| Olli Maatta #3 | Pittsburgh Penguins | Defenseman | 232.9 | 27 | |
| Damon Severson #28 | New Jersey Devils | Defenseman | 230.2 | 15 | |
| Ben Lovejoy #6 | Anaheim Ducks | Defenseman | 220.7 | 21 | |
| Brad Stuart #17 | Colorado Avalanche | Defenseman | 218.4 | 16 | |
| Adam McQuaid #54 | Boston Bruins | Defenseman | 216.8 | 18 | |
| Jon Merrill #7 | New Jersey Devils | Defenseman | 213.9 | 14 | |
| Dan Boyle #22 | New York Rangers | Defenseman | 212.4 | 16 | |
| Jonas Brodin #25 | Minnesota Wild | Defenseman | 206.2 | 11 | |
| Mikael Backlund #11 | Calgary Flames | Center | 202.4 | 29 | |
| Robyn Regehr #44 | Los Angeles Kings | Defenseman | 197.7 | 15 | |
| Joffrey Lupul #19 | Toronto Maple Leafs | Left Wing | 194.3 | 23 | |
| Ryan McDonagh #27 | New York Rangers | Defenseman | 191 | 11 | |
| Corey Perry #10 | Anaheim Ducks | Right Wing | 185.8 | 15 | |
| Bryce Salvador #24 | New Jersey Devils | Defenseman | 185 | 32 | |
| Fedor Tyutin #51 | Columbus Blue Jackets | Defenseman | 183.1 | 13 | |
| David Krejci #46 | Boston Bruins | Center | 180.7 | 17 | |
| Mikael Granlund #64 | Minnesota Wild | Center | 180.4 | 14 | |
| Joe Colborne #8 | Calgary Flames | Center | 175.1 | 17 | |
| Leo Komarov #47 | Toronto Maple Leafs | Center | 174.5 | 19 | |
| Evander Kane #9 | Winnipeg Jets | Left Wing | 173.2 | 13 | |
| Artem Anisimov #42 | Columbus Blue Jackets | Center | 173 | 30 | |
| Pascal Dupuis #9 | Pittsburgh Penguins | Right Wing | 171.8 | 31 | |
| Johnny Boychuk #55 | New York Islanders | Defenseman | 171.6 | 10 |
TABLE 3. NHL TOP 30 TMITTb-SKATER CALCULATIONS JANUARY 29, 2015
| Rank | NameNumber | Team | Position | TMITTb-skater | Injured (Team Reported) |
|---|---|---|---|---|---|
| Ryan Murray #27 | Columbus Blue Jackets | Defenseman | 14.837 | 35 | |
| Bryce Salvador #24 | New Jersey Devils | Defenseman | 12.333 | 32 | |
| Olli Maatta #3 | Pittsburgh Penguins | Defenseman | 11.644 | 27 | |
| Ryane Clowe #29 | New Jersey Devils | Left Wing | 11.097 | 34 | |
| Valeri Nichushkin #43 | Dallas Stars | Right Wing | 11.05 | 41 | |
| Artem Anisimov #42 | Columbus Blue Jackets | Center | 10.815 | 30 | |
| Pascal Dupuis #9 | Pittsburgh Penguins | Right Wing | 10.742 | 31 | |
| Mikael Backlund #11 | Calgary Flames | Center | 10.653 | 29 | |
| Patrik Nemeth #37 | Dallas Stars | Defenseman | 10.336 | 42 | |
| Dan Hamhuis #2 | Vancouver Canucks | Defenseman | 9.892 | 22 | |
| Ryan Wilson #44 | Colorado Avalanche | Defenseman | 9.6 | 42 | |
| Toby Enstrom #39 | Winnipeg Jets | Defenseman | 9.455 | 19 | |
| Zdeno Chara #33 | Boston Bruins | Defenseman | 9.032 | 19 | |
| Mark Letestu #55 | Columbus Blue Jackets | Center | 8.836 | 28 | |
| Jamie McGinn #11 | Colorado Avalanche | Left Wing | 8.739 | 29 | |
| Francois Beauchemin #23 | Anaheim Ducks | Defenseman | 8.5 | 18 | |
| Eric Brewer #2 | Anaheim Ducks | Defenseman | 8.189 | 22 | |
| Trevor van Riemsdyk #57 | Chicago Blackhawks | Defenseman | 8.176 | 29 | |
| Ben Lovejoy #6 | Anaheim Ducks | Defenseman | 8.174 | 21 | |
| Victor Hedman #77 | Tampa Bay Lightning | Defenseman | 8.057 | 18 | |
| Keith Ballard #2 | Minnesota Wild | Defenseman | 7.691 | 30 | |
| Joffrey Lupul #19 | Toronto Maple Leafs | Left Wing | 7.471 | 23 | |
| Dan Boyle #22 | New York Rangers | Defenseman | 7.324 | 16 | |
| Adam McQuaid #54 | Boston Bruins | Defenseman | 7.225 | 18 | |
| Damon Severson #28 | New Jersey Devils | Defenseman | 7.193 | 15 | |
| Jacob Trouba #8 | Winnipeg Jets | Defenseman | 7.153 | 15 | |
| Zach Bogosian #44 | Winnipeg Jets | Defenseman | 6.857 | 15 | |
| Mike Brown #18 | San Jose Sharks | Right Wing | 6.681 | 40 | |
| Brad Stuart #17 | Colorado Avalanche | Defenseman | 6.618 | 16 | |
| David Krejci #46 | Boston Bruins | Center | 6.452 | 17 |