


It feels like every time I get into a conversation with someone on twitter about how great Jonathan Huberdeau has been this season, I end up hearing the same thing: he needs to stop passing and shoot more. I get why the fanbase as a whole wants that. Our impression of who Jonathan Huberdeau is as an NHL player came on the second shift he ever took:
However, I don’t actually know if shooting less is why Huberdeau isn’t “the player we all thought he was going to be in his rookie year”. Let’s find out. I’m going to look only at 2012-2013 and 2014-15 because I think we can all agree that 2013-14 was an anomaly for Huberdeau, impacted by a variety of factors (e.g. injuries). I want to look at the Huberdeau of right now versus the Huberdeau we all kind of imprinted on in his Calder Trophy winning rookie year. Also, I am not going to break it down to shots on goal versus missed shots versus blocked shots – he’s missing the net less and having his shots blocked more but that’s not relevant so we’ll take a look at his total shot attempts.
In 2012-2013, Huberdeau attempted 152 shots at 5-on-5. He attempted 19 shots on the power play for a total of 171 shot attempts his rookie season. This season, 2014-2015, Huberdeau has 220 shot attempts at 5-on-5 and 30 power play attempts for a total of 250. The thing is, this doesn’t tell the whole story. Just like I’m a huge fan of points per 60, I want to look at Huberdeau’s shots per 60. You could also use shots per game to normalize the event rate between 2012-2013 and 2014-15 but shots per 60 is more efficient as it ignores variation in TOI. You could expect someone playing 10 minutes a night to have 2/3 the shots they would if they were playing 15 minutes a night. Let’s look at Huberdeau’s Shots per 60 and compare his rookie season to his junior season.
Shots Per 60
| Season | 5-on-5 | Power Play |
| 12-13 | 13.71 | 10.28 |
| 14-15 | 12.50 | 10.37 |
Now, his shot totals are down a little bit this year but here’s the main question: what’s everyone else doing? The team at 5-on-5 as a whole is averaging 53.80 shot attempts per 60, up from 52.50 in 2012-2013.
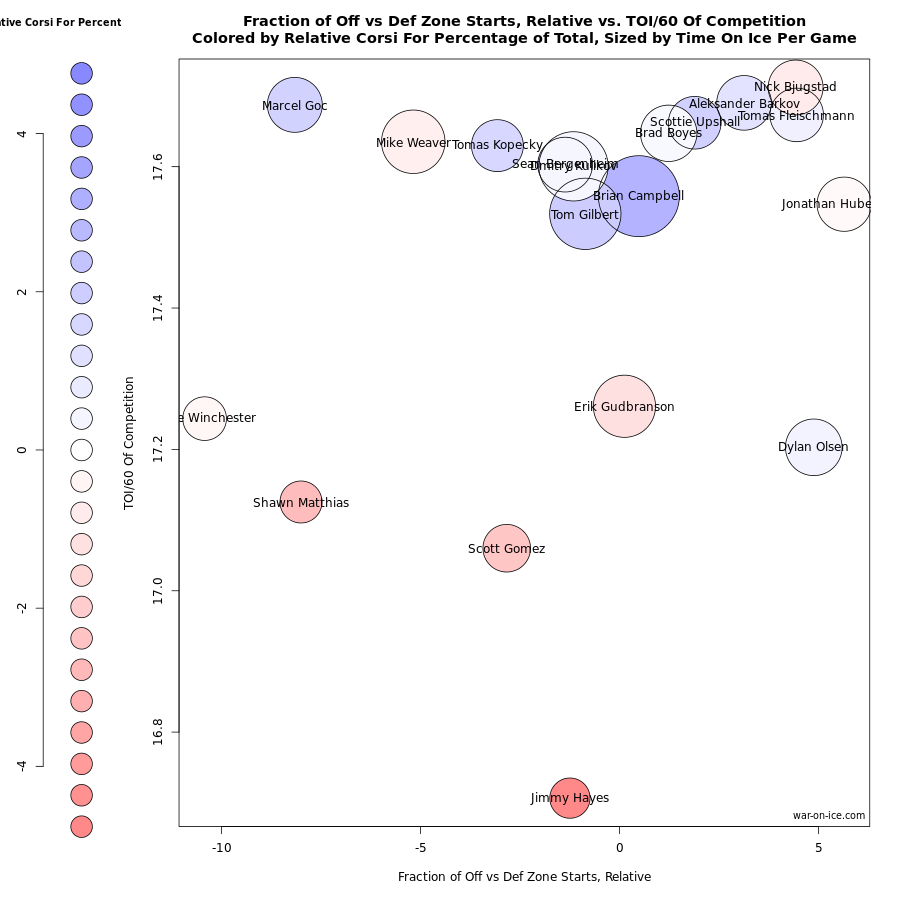
That’s not a great look for Huberdeau, although one can (and should) adjust for quality of competition. Here are the usage charts for 2012-2013 and then for 2014-15 (5-on-5, Minimum 500 Minutes):
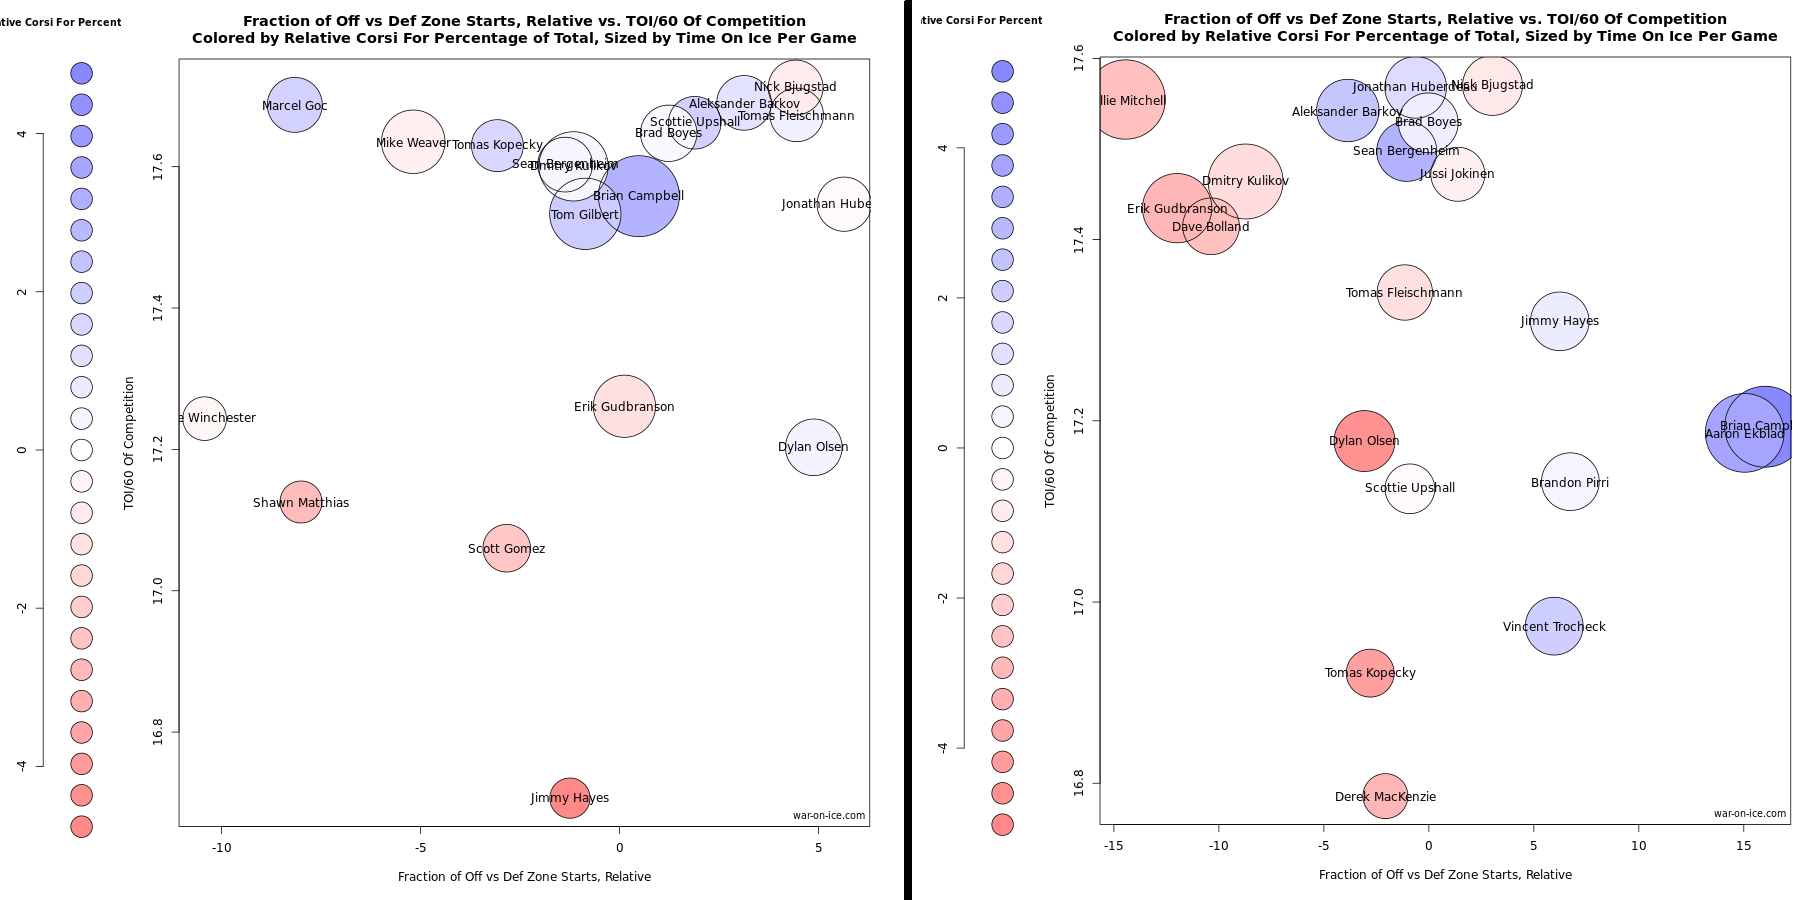
… Yeah, that means nothing, right? Okay, quickly: the higher up a player is, the more minutes the players he’s playing against play for (tongue twister, right?). This is a good approximation of quality of competition because most coaches play their better players more. The further to the right the player is, the more often that player is starting their shifts in the offensive zone. In most cases, this is great for driving offense because the player doesn’t need to exit their zone and enter the opponent’s zone.
The scale on the two images is off, at least partially because of Gallant’s usage versus Dineen’s, but Huberdeau’s facing slightly easier competition (17.623 m/game vs 17.57 m/game) while receiving noticeably tougher zone starts (-0.63% versus +10.6% relative to teammates).
Now, generally, I’m not a huge fan of shot quality because I think it’s overused and often unsustainable. However, let’s look at the shot locations for Florida with and without Huberdeau this season:
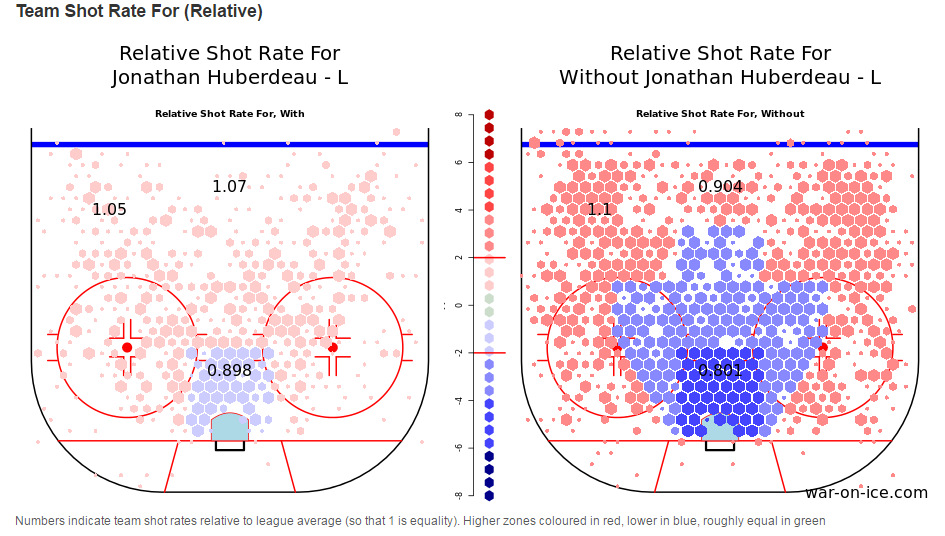
Look at that nice little note at the bottom from the folks at war-on-ice telling you how to read their amazing hextally charts. Here’s what I see: with Huberdeu on the ice, the team is close to league average in perimeter shots, above average in mid-range shots, and below average in shots in the sweet spot. Notably, however, Florida is taking fewer perimeter shots with Huberdeau on the ice than without him there and visibly more dangerous ones.
Does Huberdeau need to shoot more? Sure. Your top 90 forwards (that’s three per team, so a top line forward in the league) have at least 14 shot attempts per 60 minutes played 5-on-5 (Minimum 500 Minutes). At 12.50, Huberdeau ranks 172nd in the league — still a top six forward by that one statistic (which is not the only statistic). Ahead of him, among Florida players, are Pirri (#23), Bjugstad (#57), Kopecky (#60), Hayes (#108), Upshall (#138), Trocheck (#144), Jagr (#160), and Trocheck (#167). You’d like to see more out of him, but here’s the thing: Jonathan Huberdeau is a spectacular playmaker. Top guys in shot attempts are going to be shoot first guys, like Pirri and Bjugstad and Hayes.
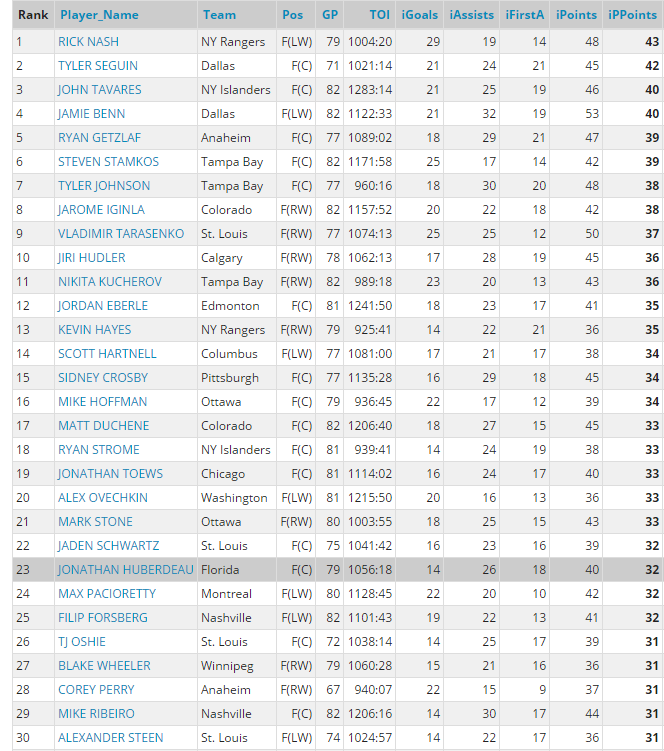
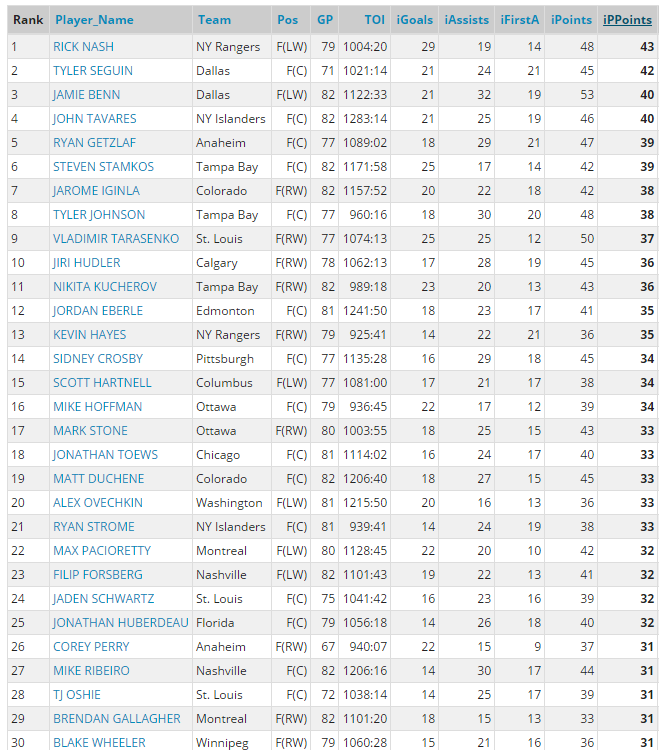
At 21 years old, Jonathan Huberdeau leads his team in points and assists. There’s also this:
That’s every player in the league, sorted by 5-on-5 primary points (goals and first assists). Please note that Jonathan Huberdeau is near elite company. Whatever you think is holding Florida back, it’s not Huberdeau’s passing. In fact, he is tied for seventh in the league in primary assists. As far as I’m concerned, he can keep right on doing what he’s doing.
All numbers and the final chart taken from puckalytics.com; all other charts taken from war-on-ice.com, the two sites without which I would not make sense of anything.