


Hit The Ice:
Groan. Sigh. Those were about the most appropriate reactions to Tuesday night’s third period meltdown against the Tampa Bay Lightning. The Panthers strung together three goals in just 1:58 in the second period and thoroughly dominated the Lightning on SATs, but in the end it wasn’t enough. Now, with playoff hopes waning, the Panthers limp north of the border to play the laughingstock Leafs. Though the Panthers should win this game, they should also remember this team won last time there was a game between them. Can the Panthers keep their playoff candle burning? On to the game!
Know Your Enemy:
Panthers All-Time Record v. Toronto: 29-29-5 with 7 ties
All-Time Record v. Toronto on the Road: 13-15-3 with 2 ties
2014-15 Season Record v. Toronto: 2-1-0
Last Game: 3/3/15 @ BB&T Center, Maple Leafs won 3-2
Last time we saw the Toronto Maple Leafs, they skated away with a 3-2 victory in easily the strangest game of the year, possibly the decade. Scoring only one goal on a statuesque Al Montoya was all they needed to salt away the victory. Certainly a strange victory like that should have some sort of positive impact on a team, right? Yeah, about that… the Leafs have won exactly once in the ten games since that night, that win coming by way of the shootout over the Buffalo Sabres. They have now lost six games in a row following that victory. Their top line of James van Riemsdyk, Tyler Bozak, and Phil Kessel has combined for seven points over the last ten games. Their second line of Joffrey Lupul, Trevor Smith, and ex-Panther David Booth have combined for eight points. Six of those points have come from Booth, who is tied with defenseman Jake Gardiner for the team lead in points over the last ten games. As a team, they have the 2nd worst score adjusted SAT% at 40.9, further solidifying their mediocrity. There’s not much else to say about this team, they are abjectly terrible. This team is not only up a creek without a paddle, the canoe is on fire and fast approaching a waterfall.
Historical Data Courtesy of Hockey-Reference.com
The Rundown:
Panthers Leaders & Special Teams
Goals: Nick Bjugstad (24)
Assists: Jussi Jokinen (33)
Points: Jonathan Huberdeau (44)
SAT Relative: Brian Campbell (+4.3%)
Scoring Chances Relative: Brian Campbell (+5.5%)
Individual Shot Attempts (Total): Nick Bjugstad (238)
Individual Shot Attempts (Rate/60): Brandon Pirri (17.4)
Power Play: 14.9% (33 for 221, 28th)
Penalty Kill: 80.4% (177 for 220, 22nd)
Maple Leafs Leaders & Special Teams
Goals: Phil Kessel & James van Riemsdyk (24)
Assists: Phil Kessel (30)
Points: Phil Kessel (54)
SAT Relative: Jake Gardiner (+5.3%)
Scoring Chances Relative: Jake Gardiner (+6.4%)
Individual Shot Attempts (Total): Phil Kessel (286)
Individual Shot Attempts (Rate/60): Phil Kessel (16.4)
Power Play: 16.7% (43 for 257, 22nd)
Penalty Kill: 81.1% (197 for 243, 16th)
Data Courtesy of war-on-ice.com, Puckalytics.com, & NHL.com
The Hat Trick:
Since the Madness: Last time we saw these two teams play against each other, we nearly saw the first appearance of an emergency goaltender in an NHL game in over 50 years. There was no shortage of drama between Derek MacKenzie, Scottie Upshall, and Robb Tallas each thinking they would play goal at some point, Al Montoya remaining in the game with the mobility of quicksand, and Luongo ultimately returning to the arena and the game in an effort to save the day. Since that game though, Panthers goaltending has looked pretty good. Dan Ellis made six appearances while both Luongo and Montoya were on the mend, posting an adjusted save percentage of .921. Meanwhile, Luongo has come back with a .924 adjusted save percentage in three games since returning to action. Losing both of goaltenders was a recipe for disaster. Luckily for the Panthers, Dan Ellis was up to the challenge and made sure goaltending was not the downfall of the Panthers
Danger Zone: Speaking of goaltenders, it is interesting to note the performance of our goaltenders when facing tougher shots. Among goaltenders who have played a minimum of 240 minutes, Dan Ellis leads all NHL goaltenders in save percenage on shots originating immediately around the goalmouth at .907. The only other goalie over .900 is the sensational Andrew “Hamburglar” Hammond at .906. On the flipside, Roberto Luongo is middle of the pack at .835, while Al Montoya sports the 15th worst save percentage at .795. If we scale back to look at medium danger shots, encompassing the home plate shaped area extending from the net out to the faceoff dots and straight to the top of the faceoff circles, with the central portion of the point also included. Dan Ellis ranked 5th in the league at .952, while Luongo is again middle of the pack at .913 and Al Montoya is 4th worst at .864. Ellis’ numbers almost certainly look better due to small sample, and would regress closer to his career averages over the long term, while Luongo’s are more in line both with his career averages and the league averages. For Montoya though, this year represents one of his worst statistical years. The Panthers have it all in net: great performances, average performances, and bad performances.
The Trends Say: As we near the end of the regular season, we can start to take a look back at the season and ponder what we have witnessed. One way we can evaluate how the season has gone so far is to break it down into ten game segments. Then, we can look at each of these segments to gauge how the Panthers have advanced throughout the season. Because we are at Game 74 tonight, we obviously have seven sets of ten games, plus the last three games (which we will set aside). The Panthers posted four ten game segments with a SAT rating over 50%. The best segment came between games 21 and 30, where the Panthers posted a 57.2% SAT rating, and their best 10 game record of 6-2-2. In fact, they posted a winning record in each of their other three +50% ten game segments (53.4%, 6-3-1 in games 31-40; 52.9%, 5-4-1 in games 61-70; 52.1%, 4-2-4 in games 1-10). As for the remaining segments, the best possession wise was between games 41 and 50, barely breaking even at 50.3%. However, this was the worst record wise, going 3-6-1. The other two are both sub-50%, going 47.3% between games 51 and 60 for a 3-4-3 record, and posting a 46.5% between games 11 and 20, breaking even at 4-4-2 over that stretch. All in all though, the trend is clear: when the Panthers were controlling the puck, they were winning games.
Projected Lineup:
Florida Panthers
L1: Huberdeau | Barkov | Jagr
L2: Pirri | Trocheck | Boyes
L3: Jokinen | Bolland | Hayes
L4: Upshall | MacKenzie | Thornton
D1: Campbell | Ekblad
D2: Mitchell | Gudbranson
D3: Kulikov | Petrovic
SG: Luongo
BG: Ellis
Toronto Maple Leafs
L1: van Riemsdyk | Bozak | Kessel
L2: Lupul | Smith | Booth
L3: Panik | Komarov | Kozun
L4: Bailey | Carrick | Lindstrom
D1: Brewer | Phaneuf
D2: Gardiner | Rielly
D3: MacWilliam | Erixon
SG: Bernier
BG: Reimer
Courtesy of Daily Faceoff (Accurate as of 1:30 pm)
Closing Thoughts:
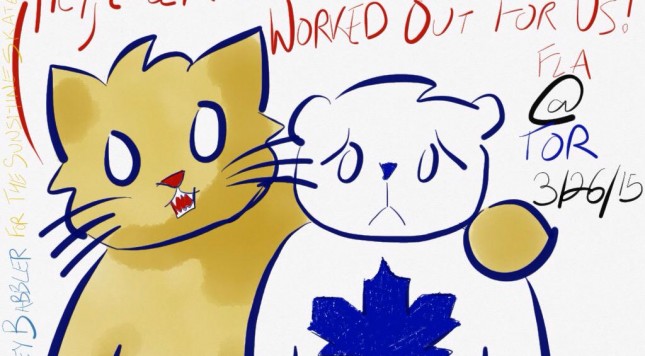
I’d take a snarky swipe at the Toronto Maple Leafs, but that would be mean. So instead, here’s a cat eating a banana.